Visualisation
Enhance the control of your plant components by having an overview of the plants at all times and even being able to control them.
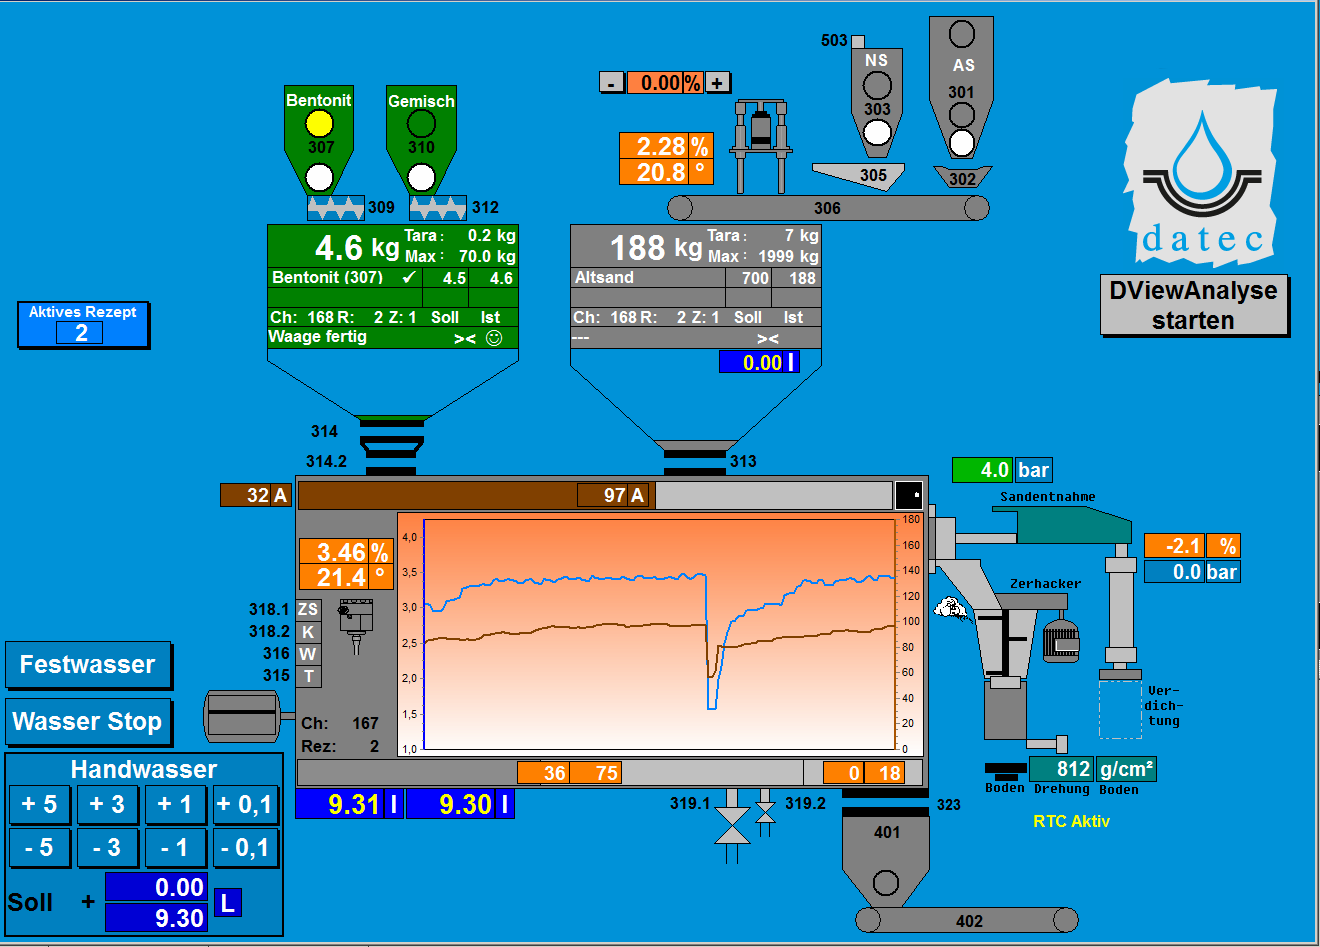
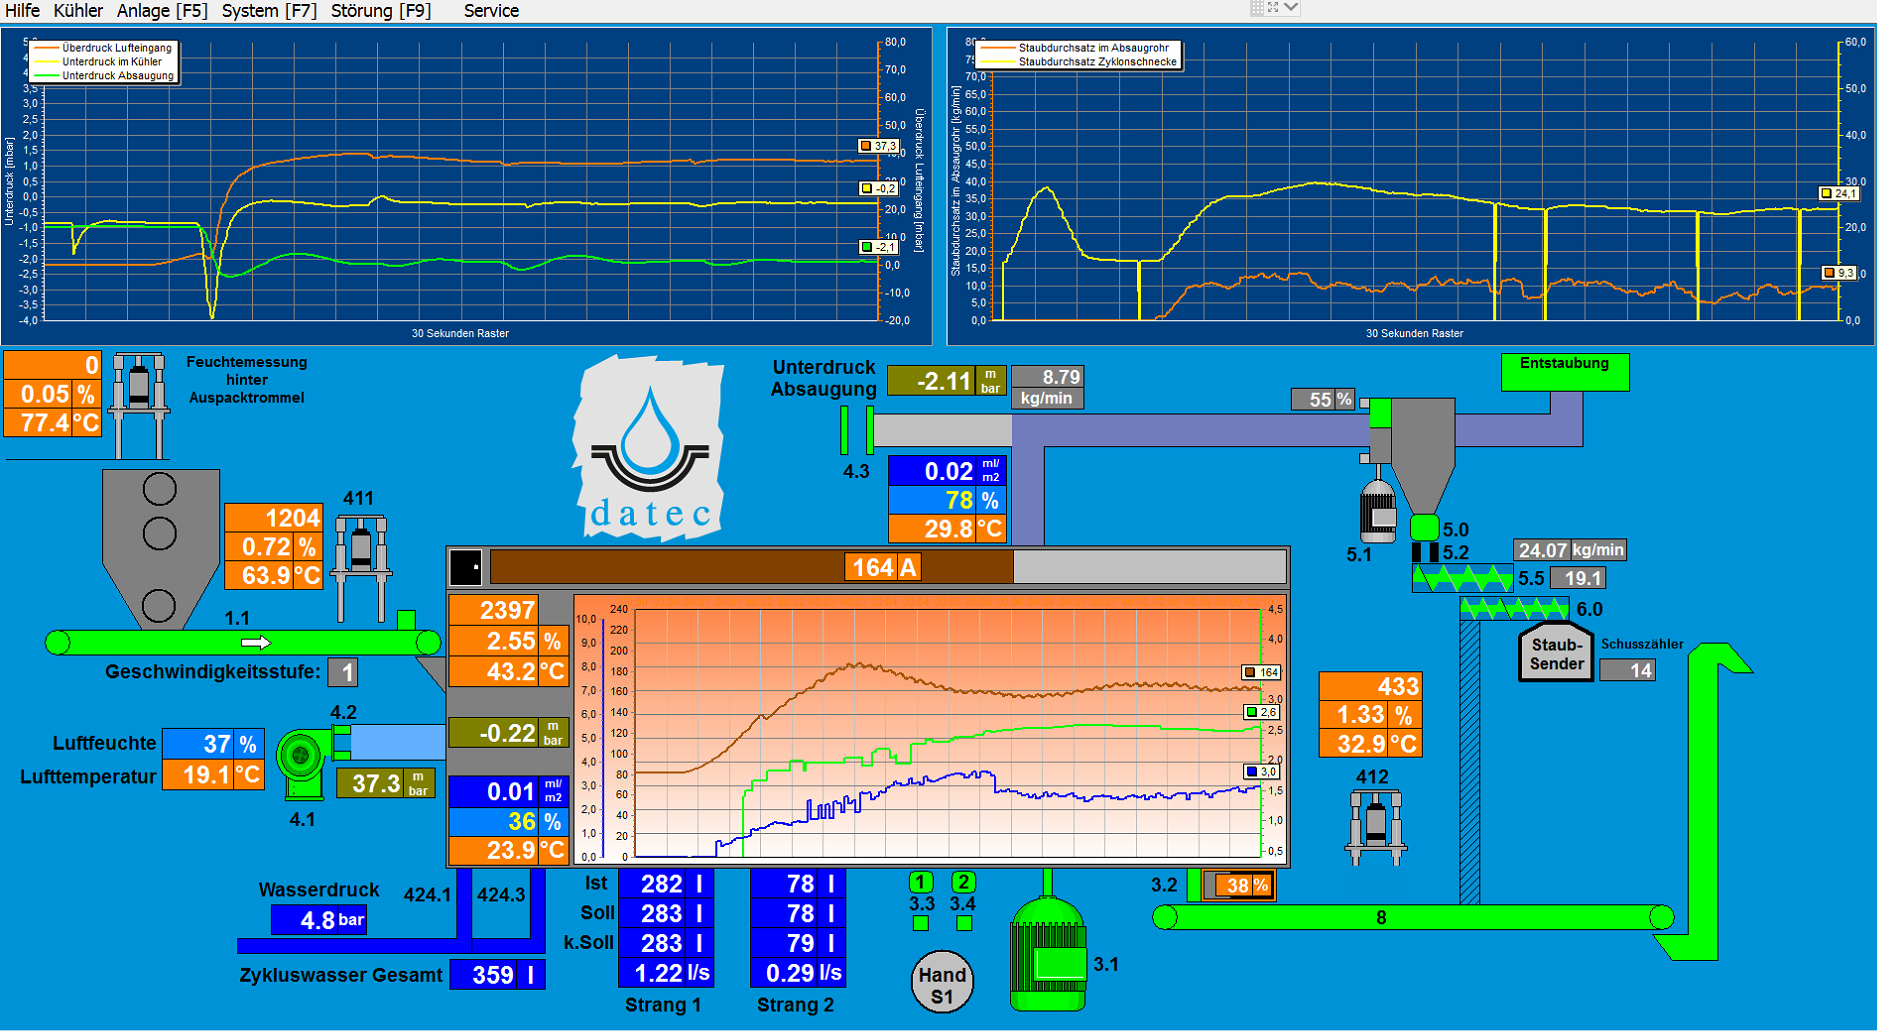
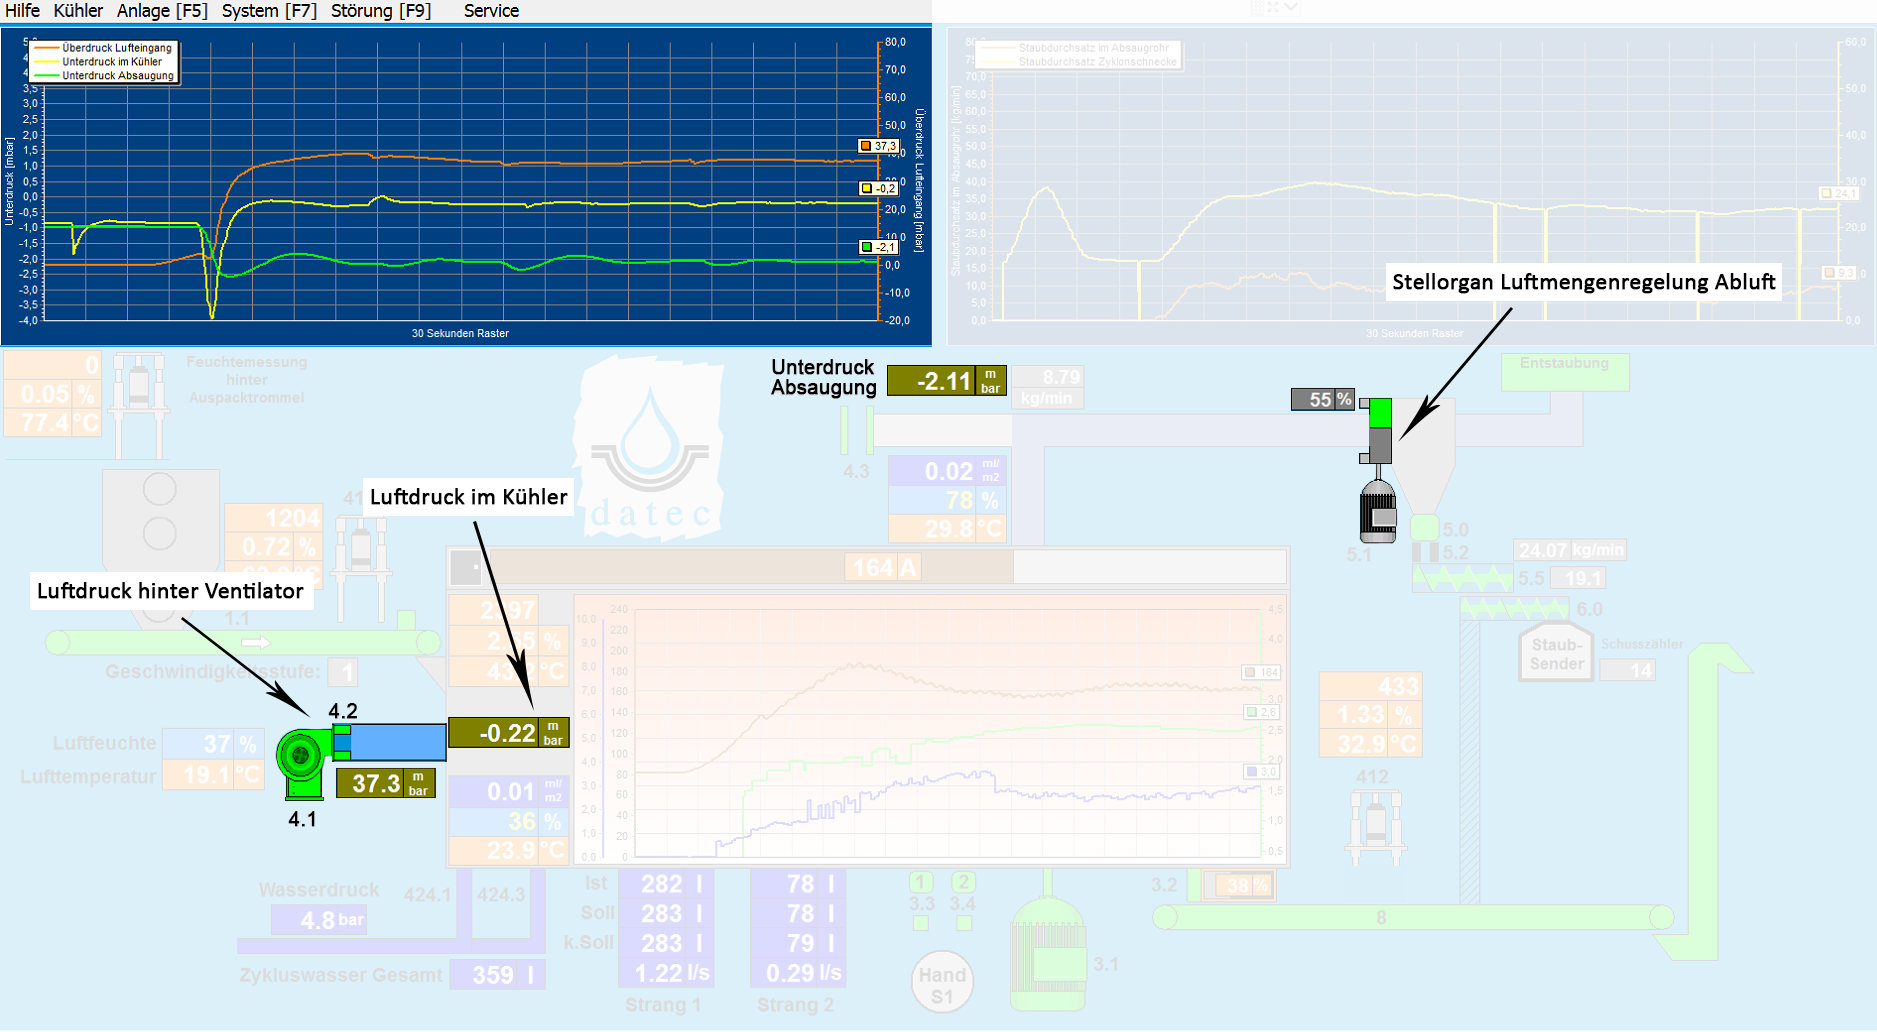
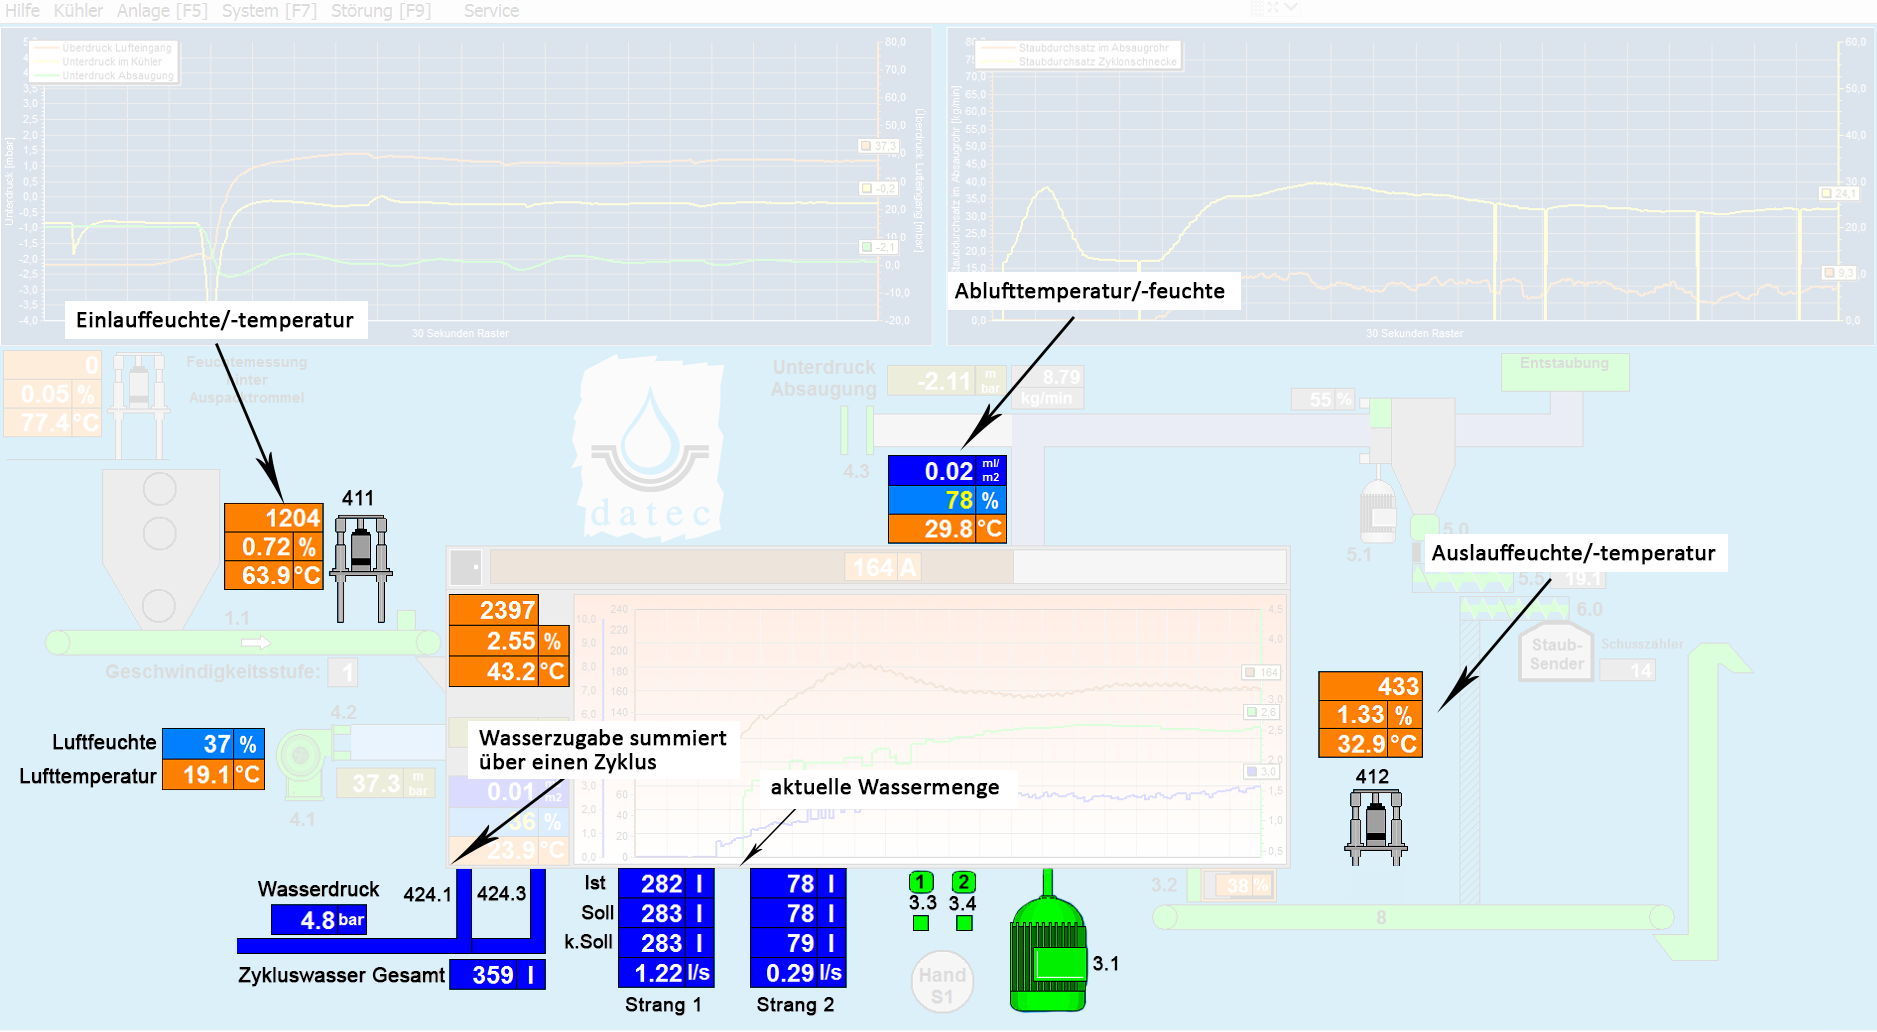
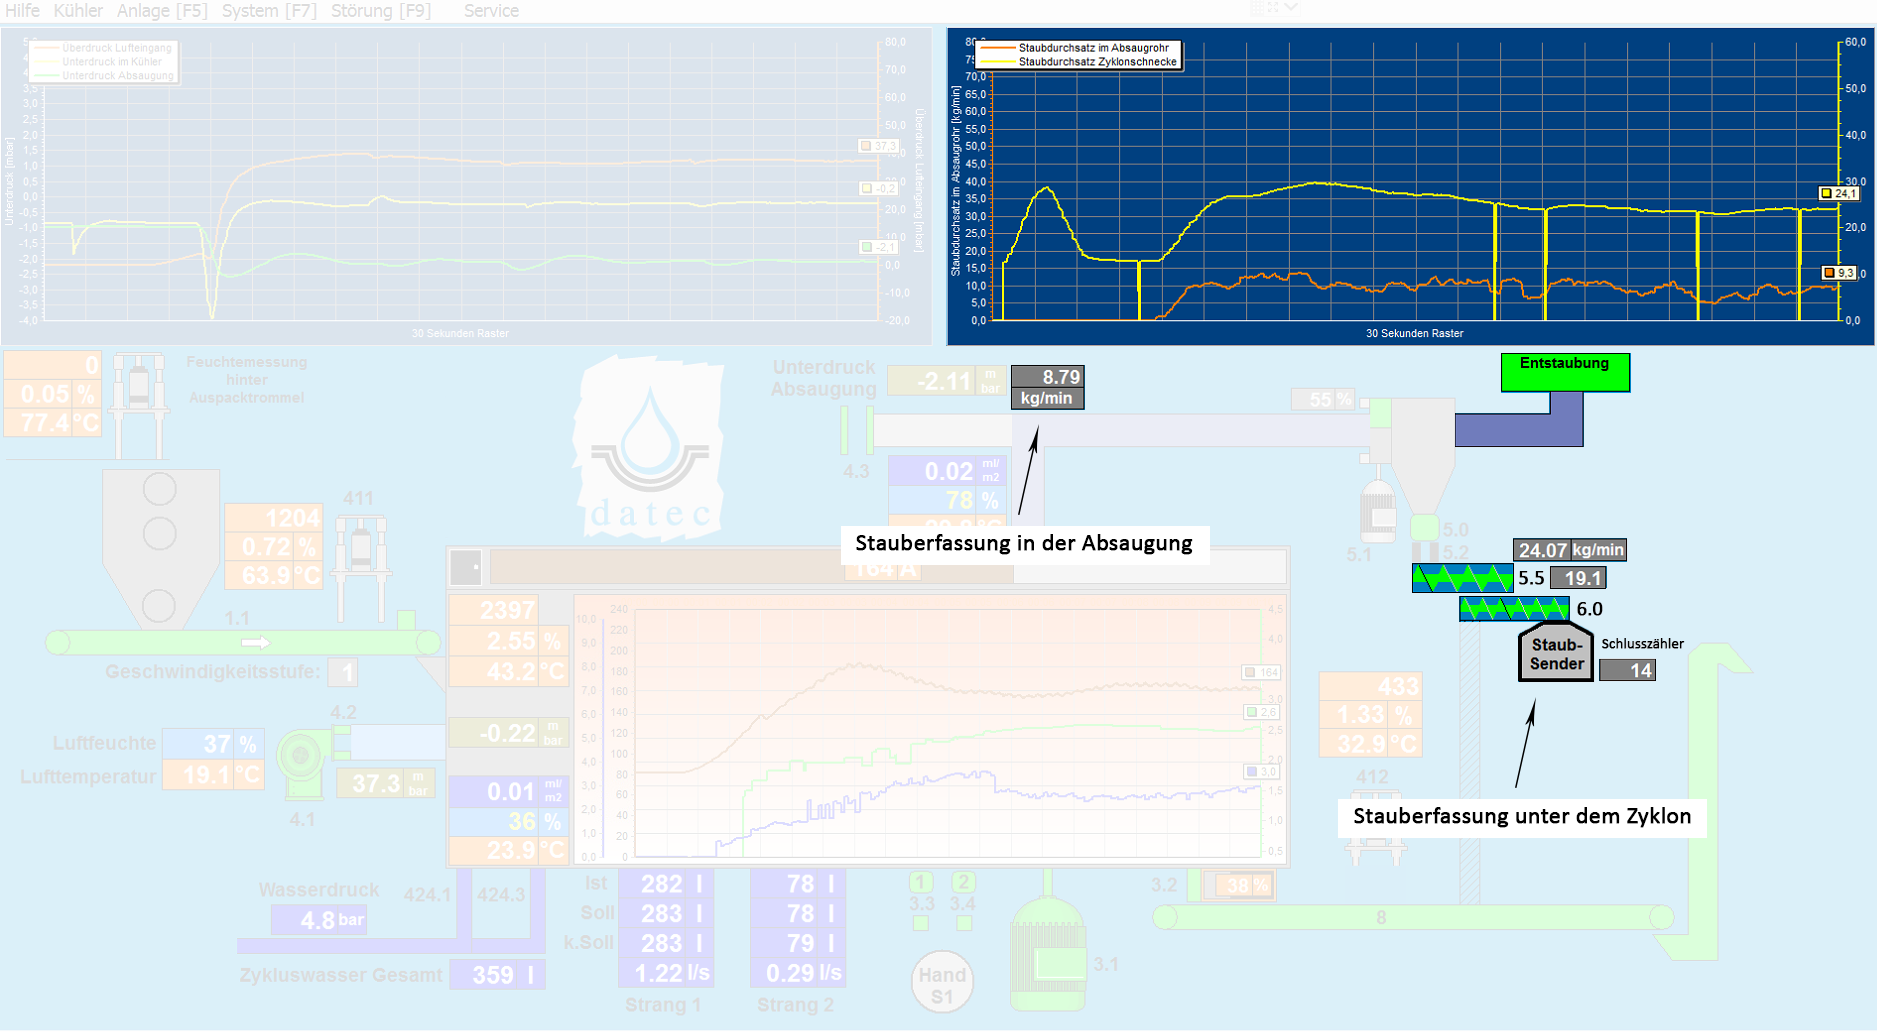
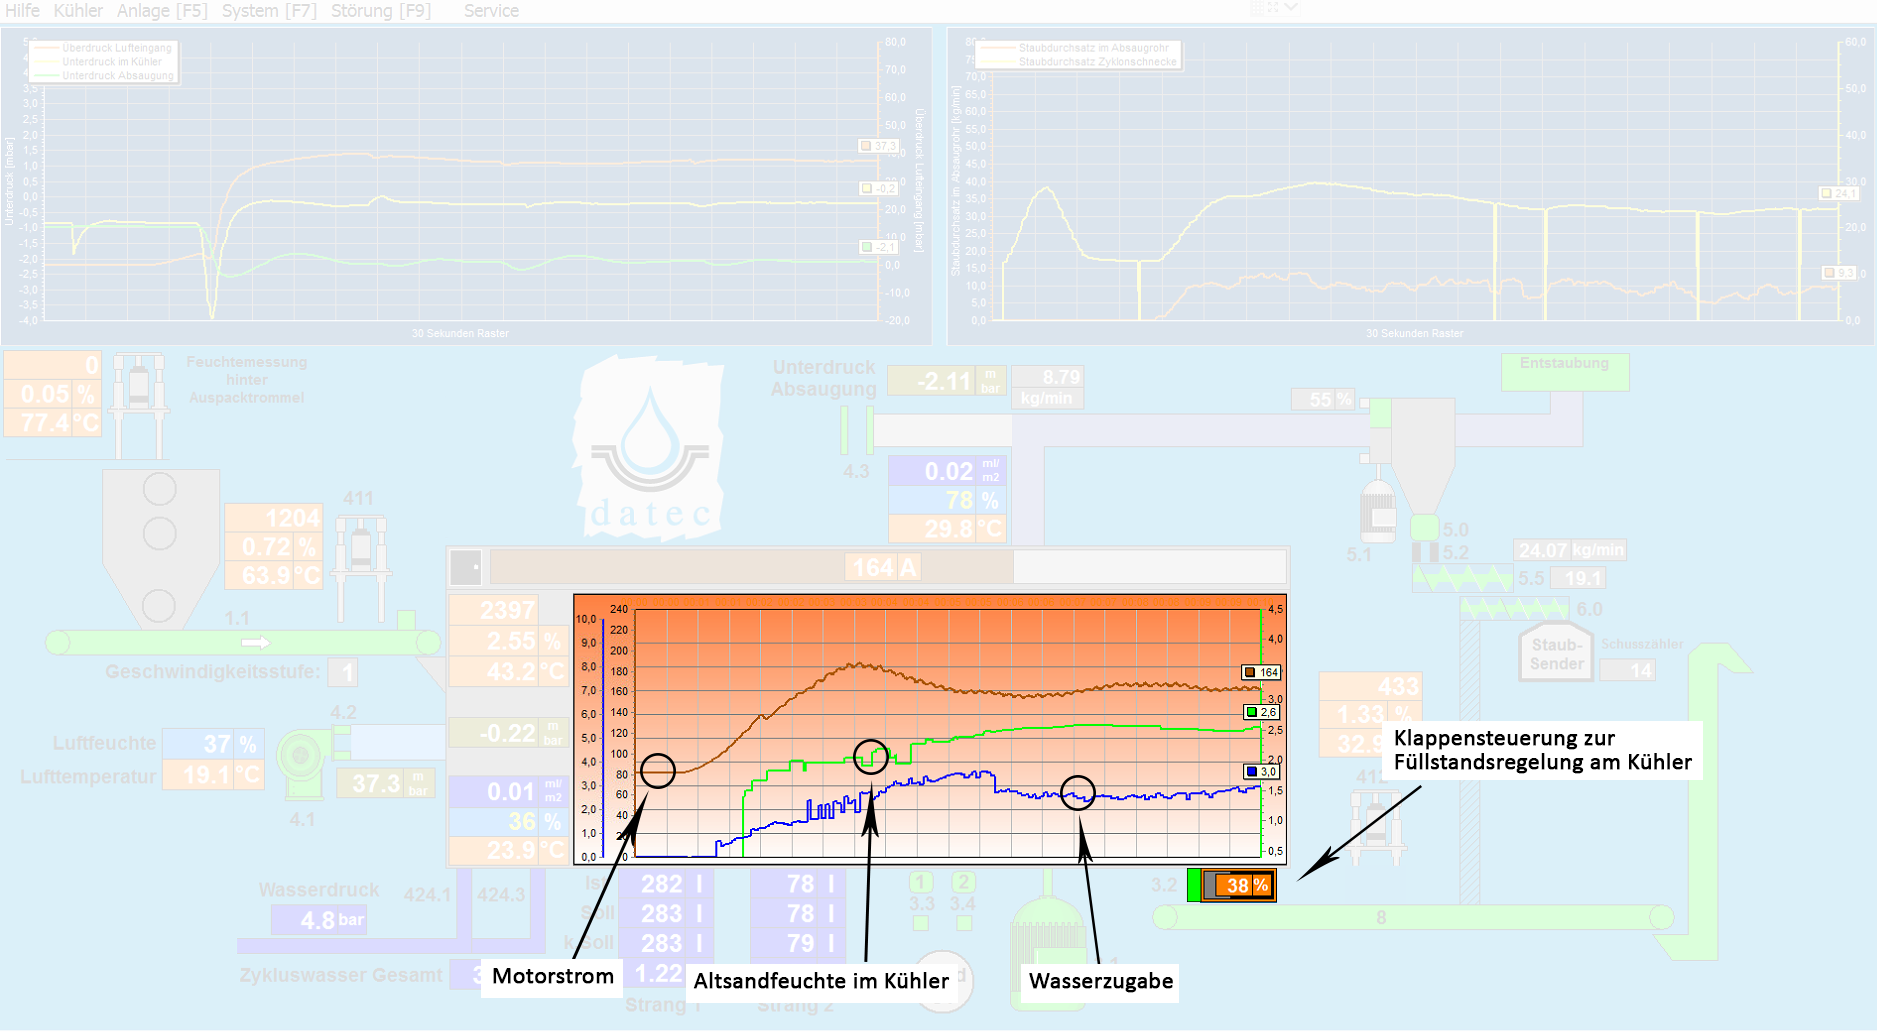
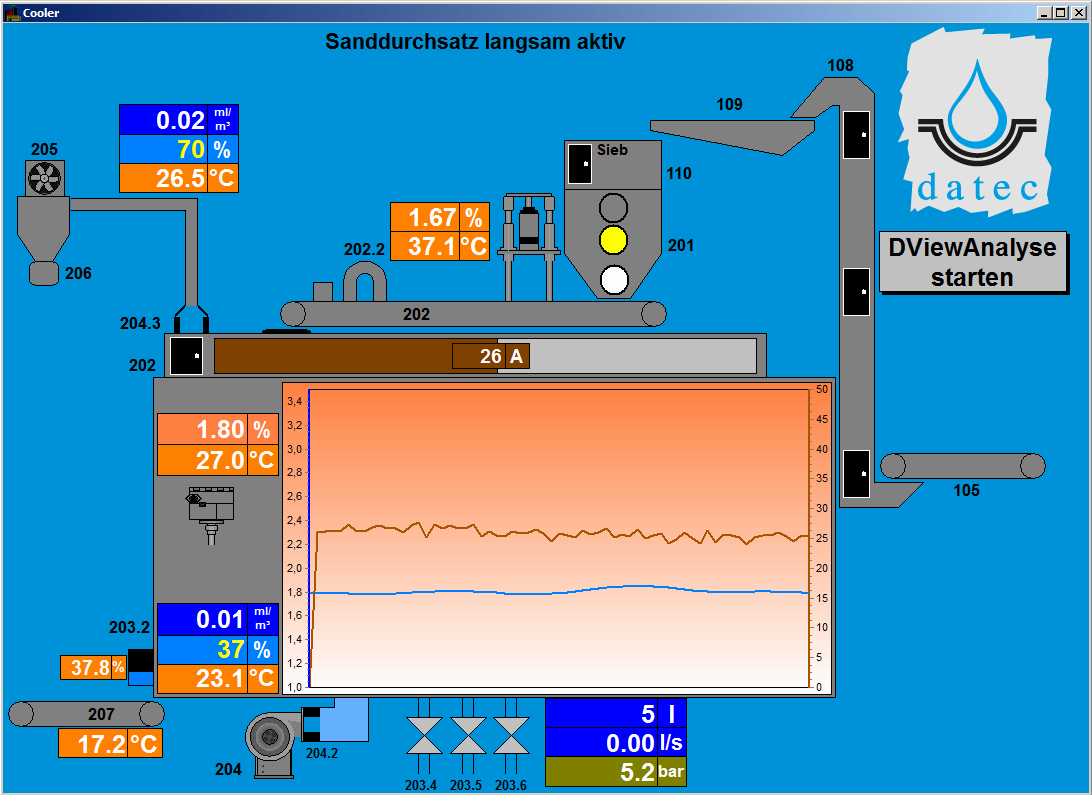
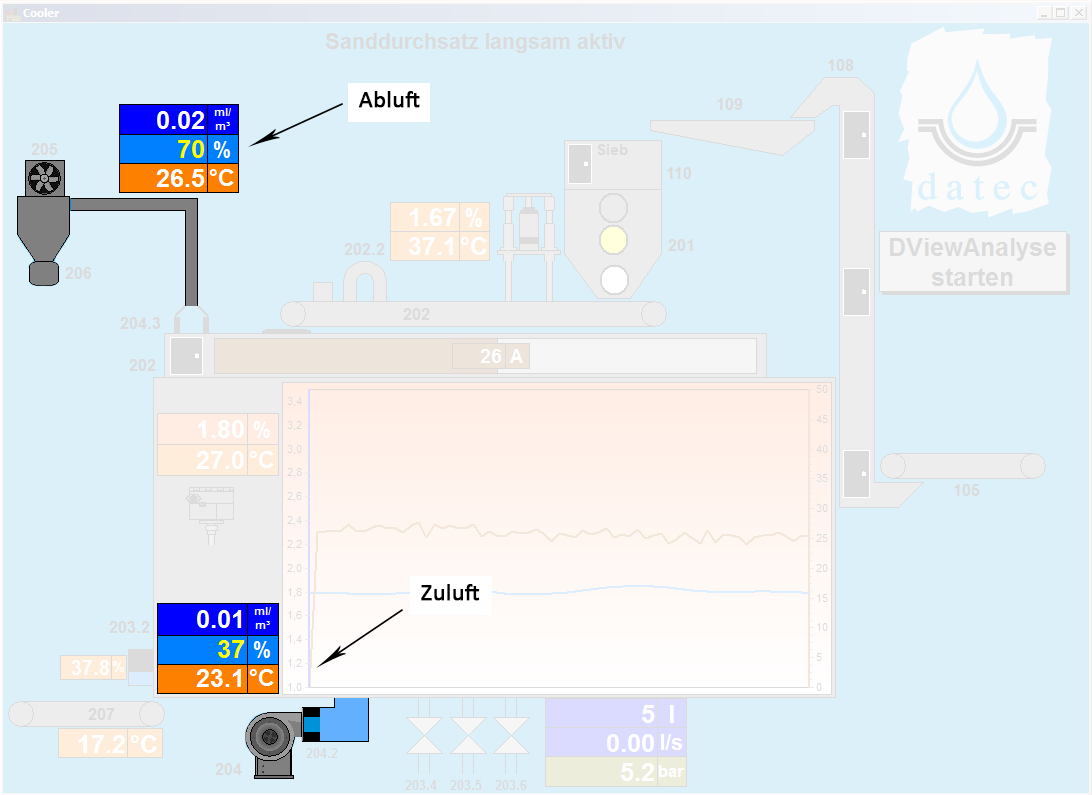
A plant should be completely represented with all its aggregates and the resulting signal states, as well as with your measured values. All plant components are to be recorded at a glance.
The core function of the visualisation is the display of plant states (faults) and the setting of parameters. The generated data from the operating data acquisition (BDE) and machine data acquisition (MDE) are archived in an SQL server with network connection. A multi-user capable program system allows access from any computer. The data streams are evaluated with the methods of statistical process control.
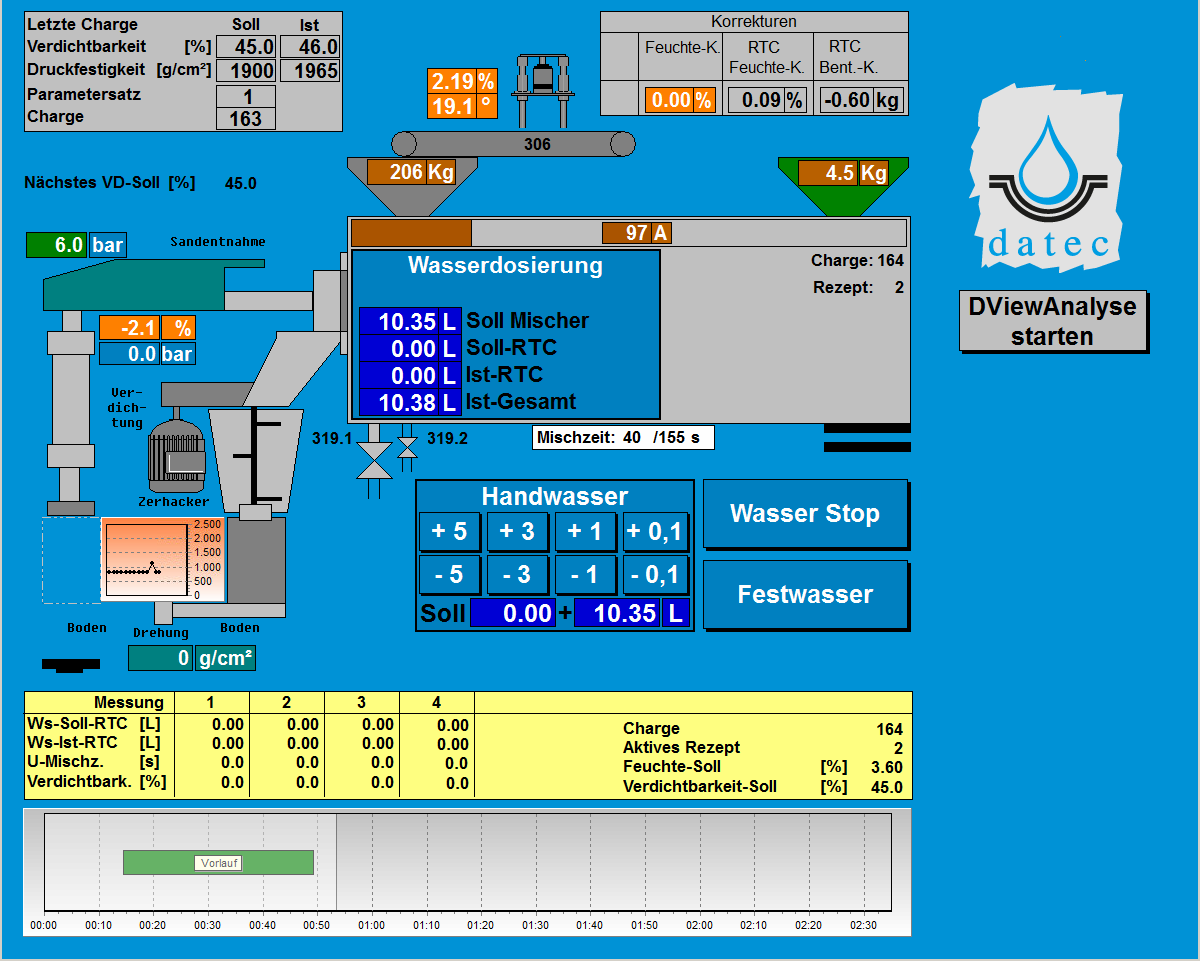
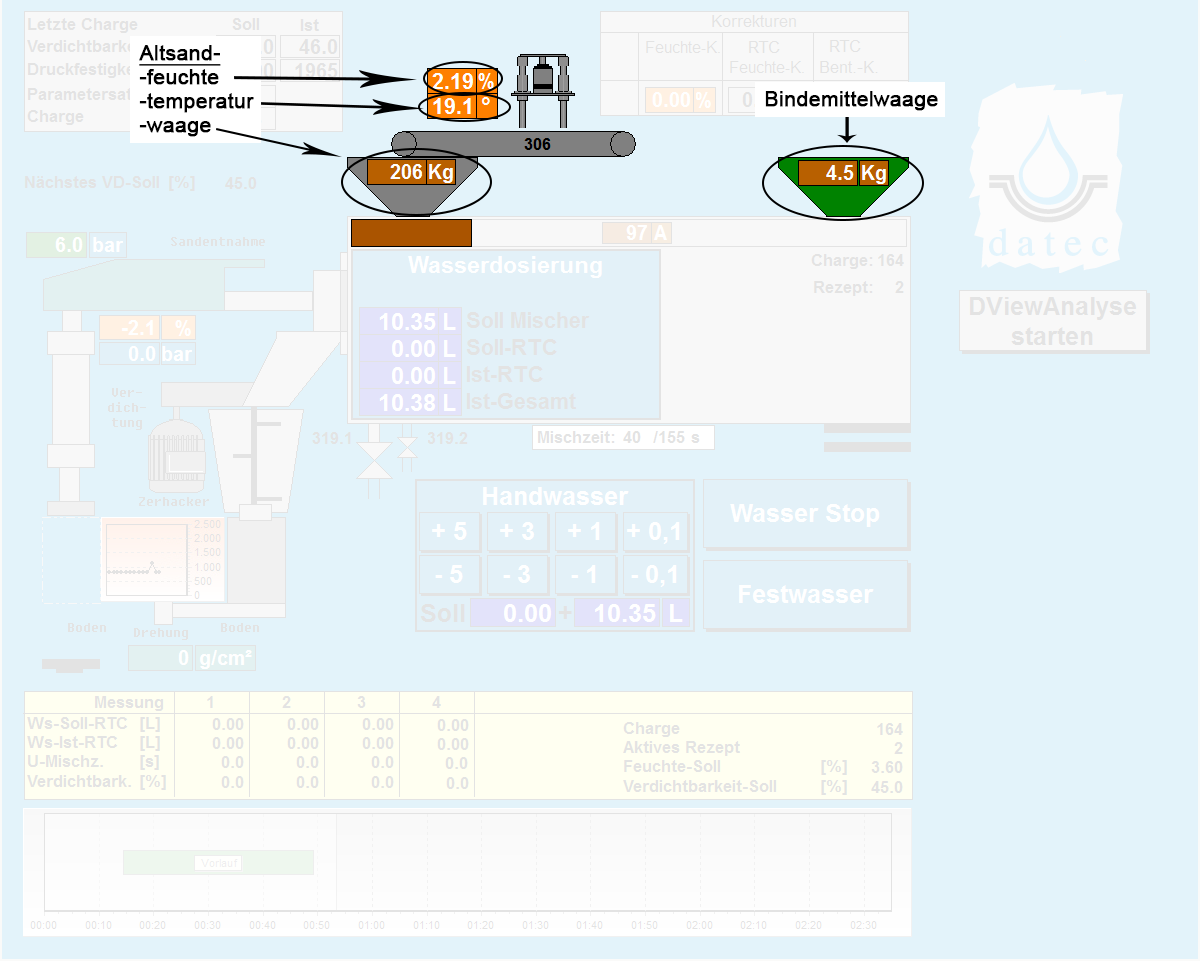
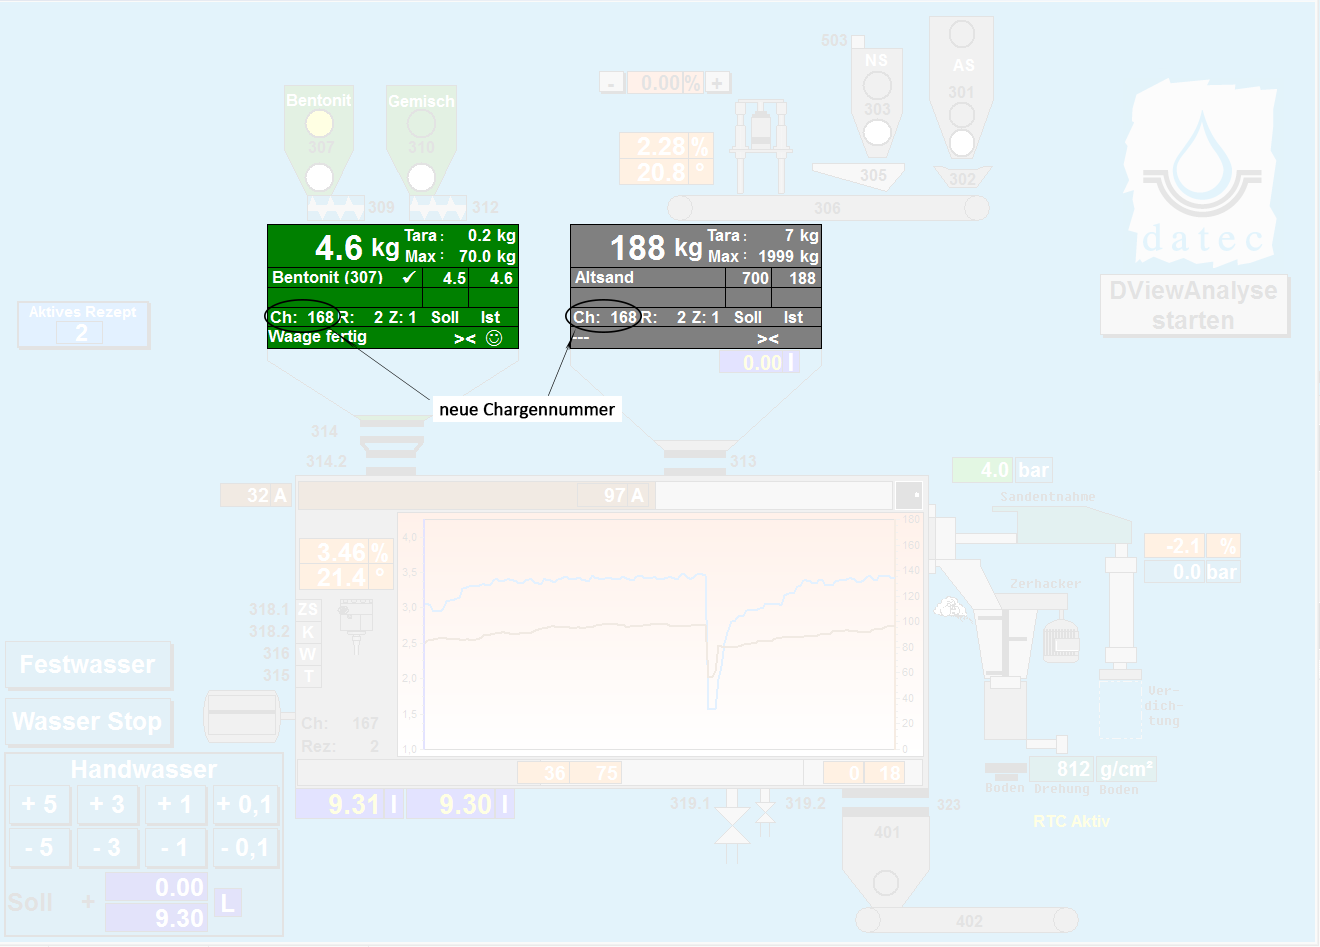
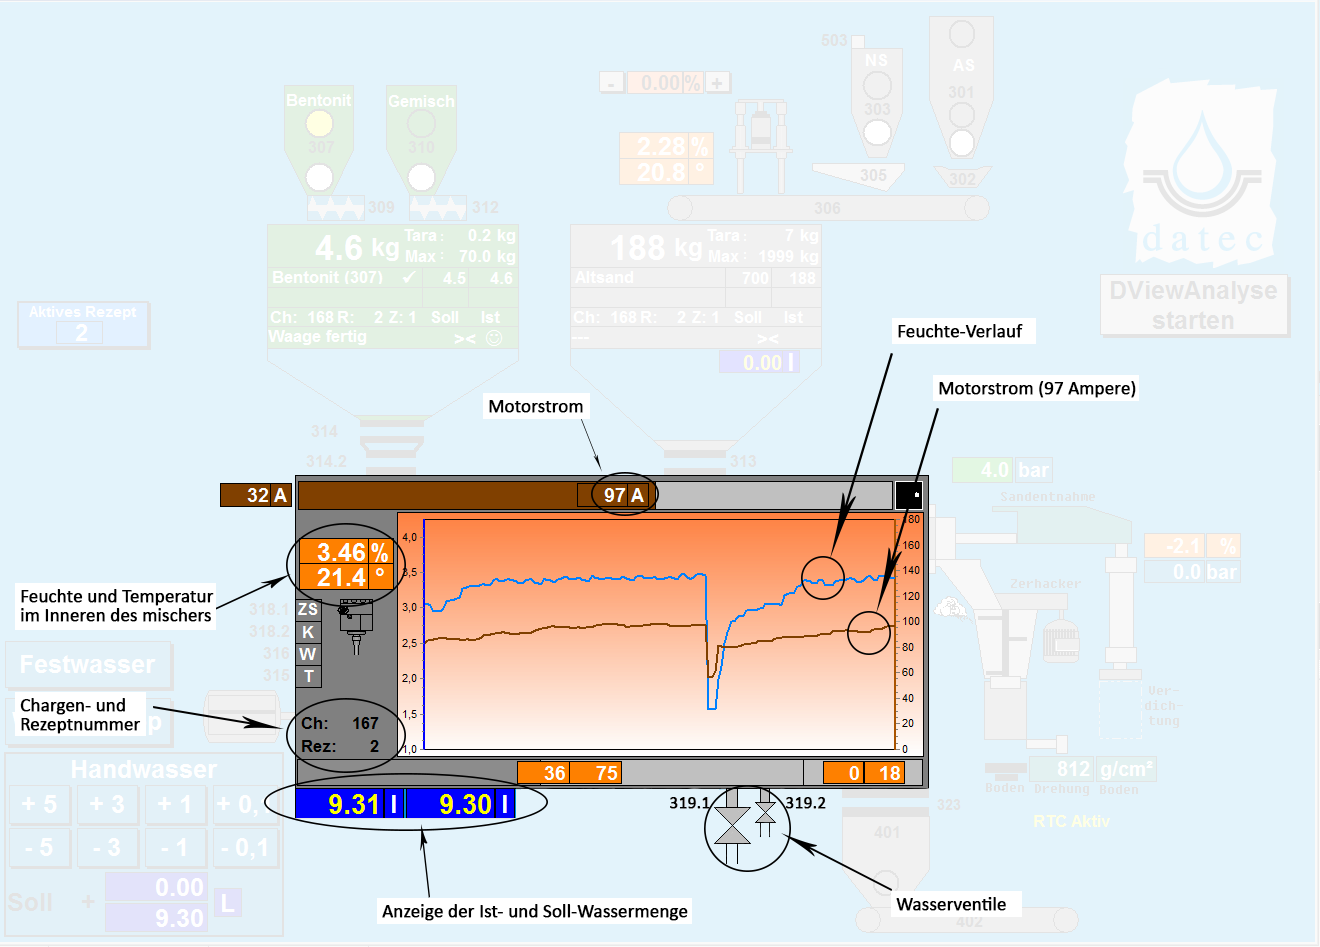
The visualisation generally shows a functional diagram of the operating states of your plant on a display. Here the overall picture can be shown or you can switch to detailed pictures.
The following are shown, for example
- Process states (stationary, faulty, running)
- Error messages
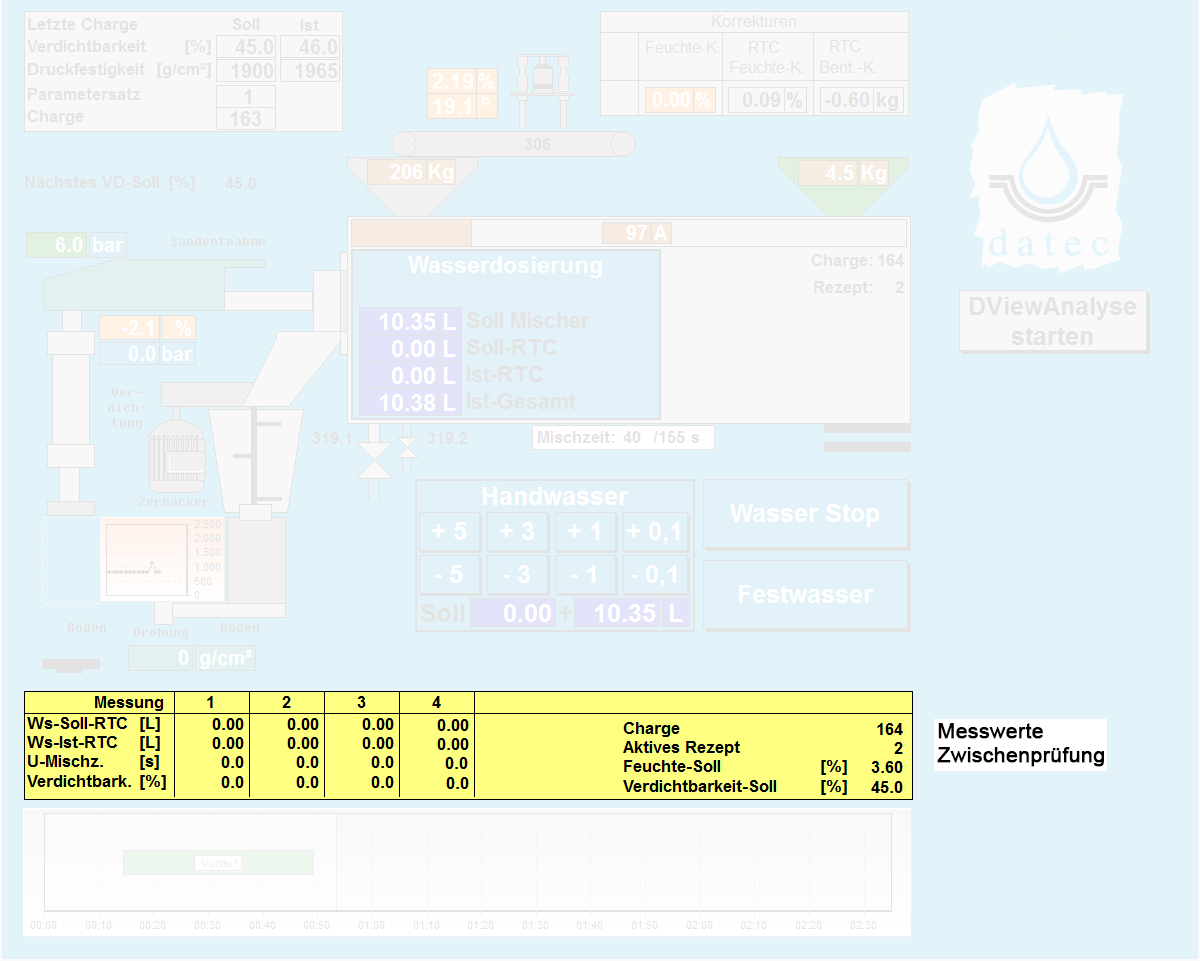
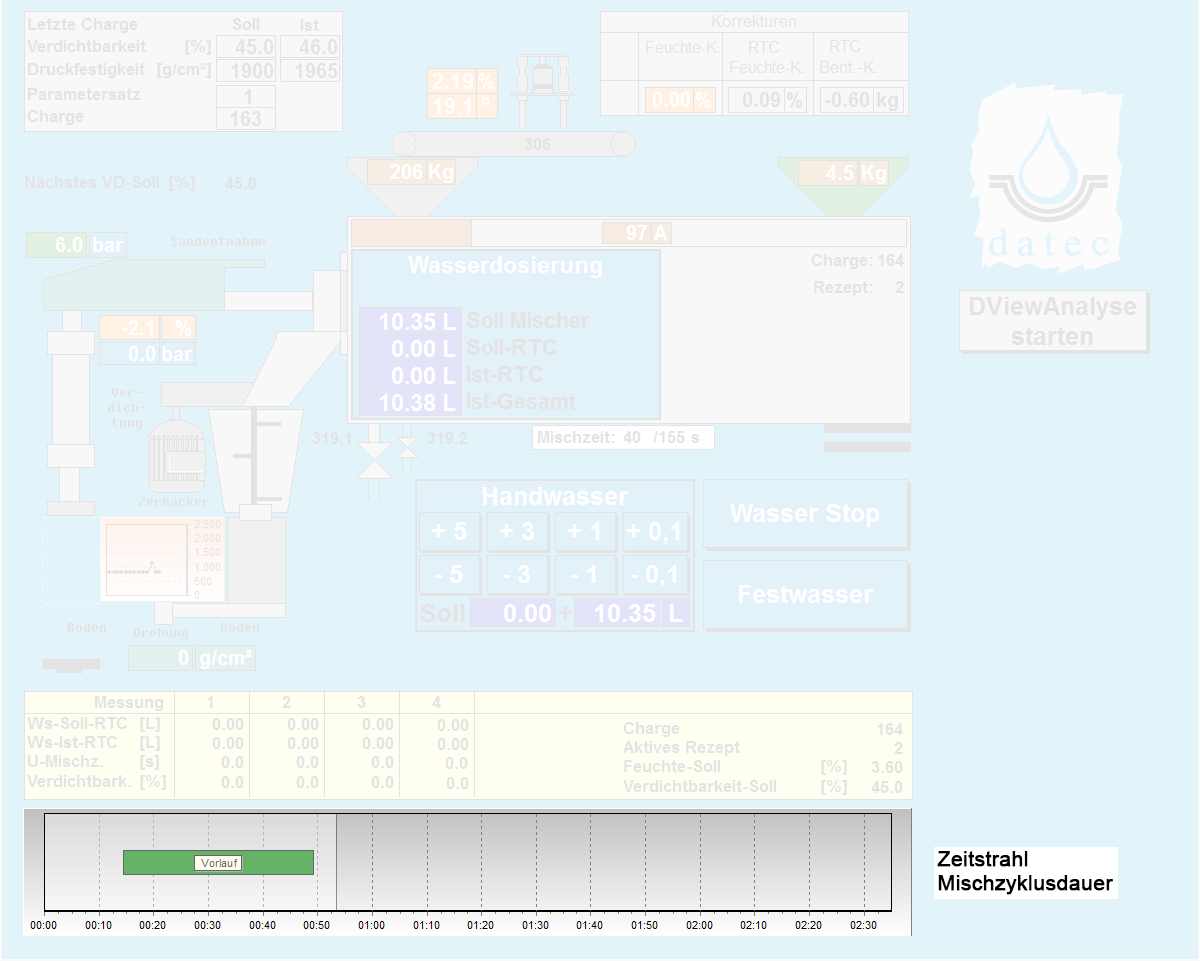
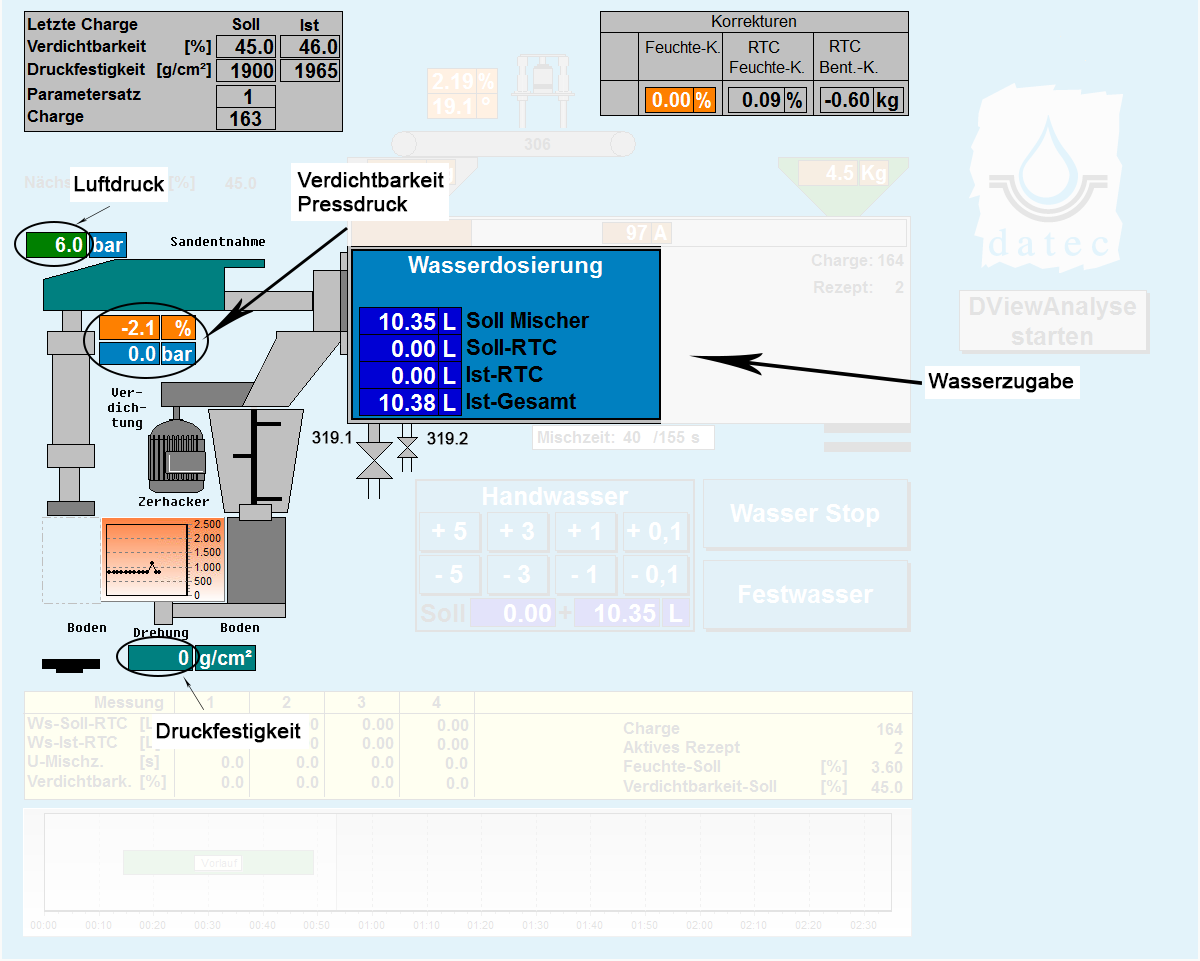
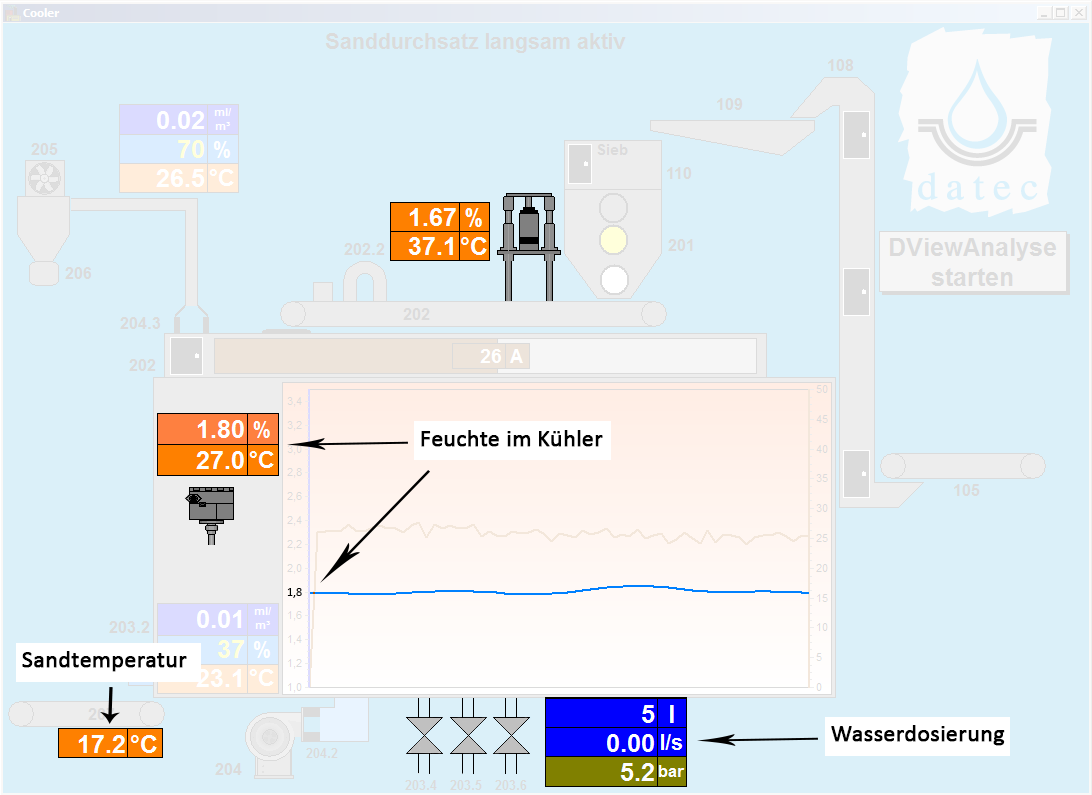
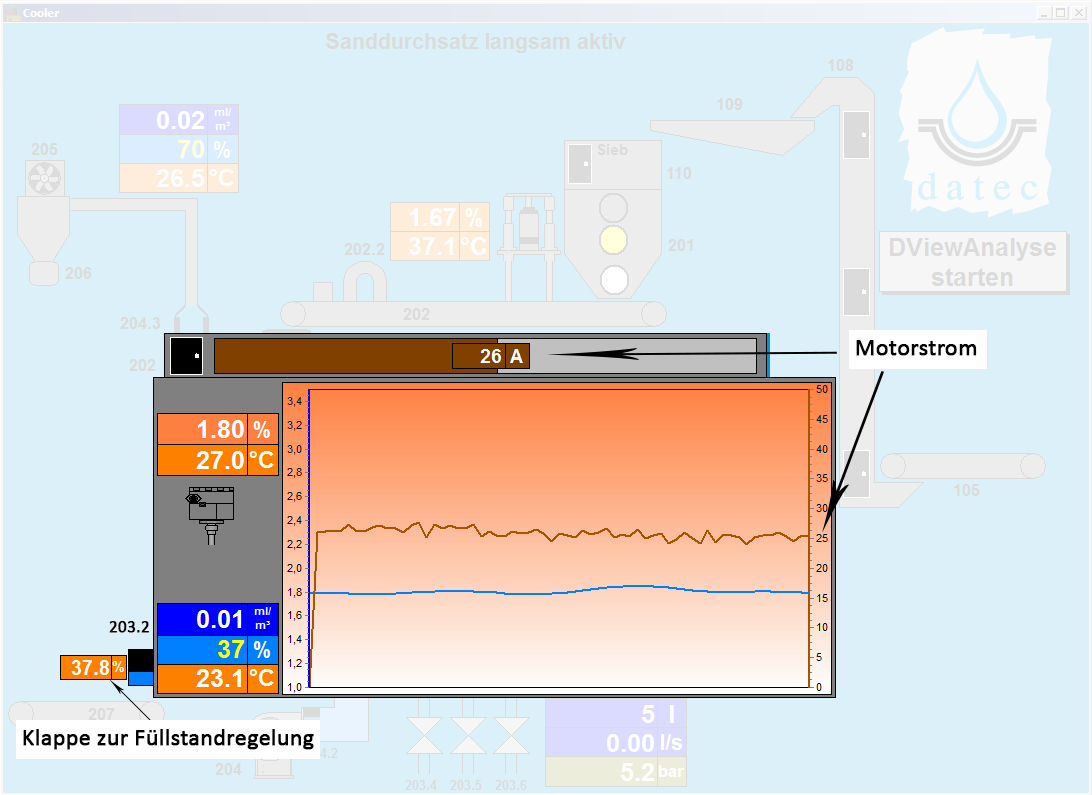
- Measured values and short-term trends
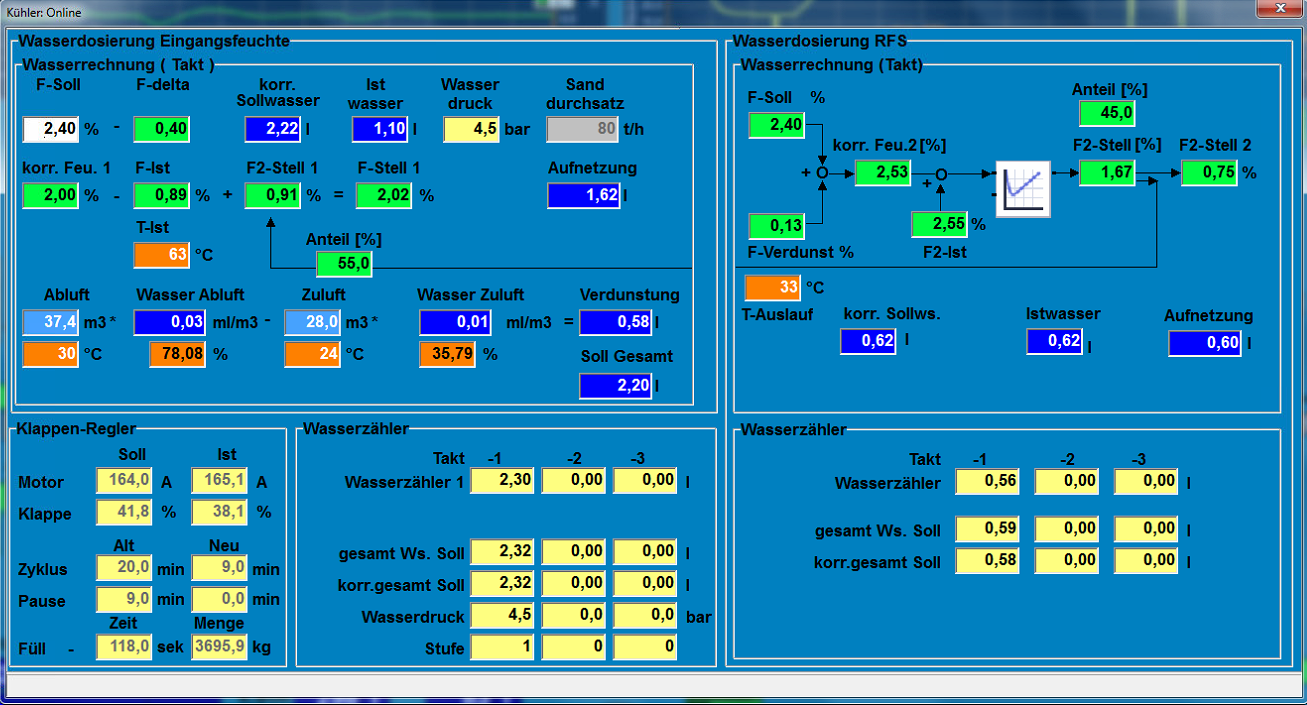
- Control parameters
Operating parameters are set, e.g:
- Recipe values
- Operating hours
- Weighing parameters
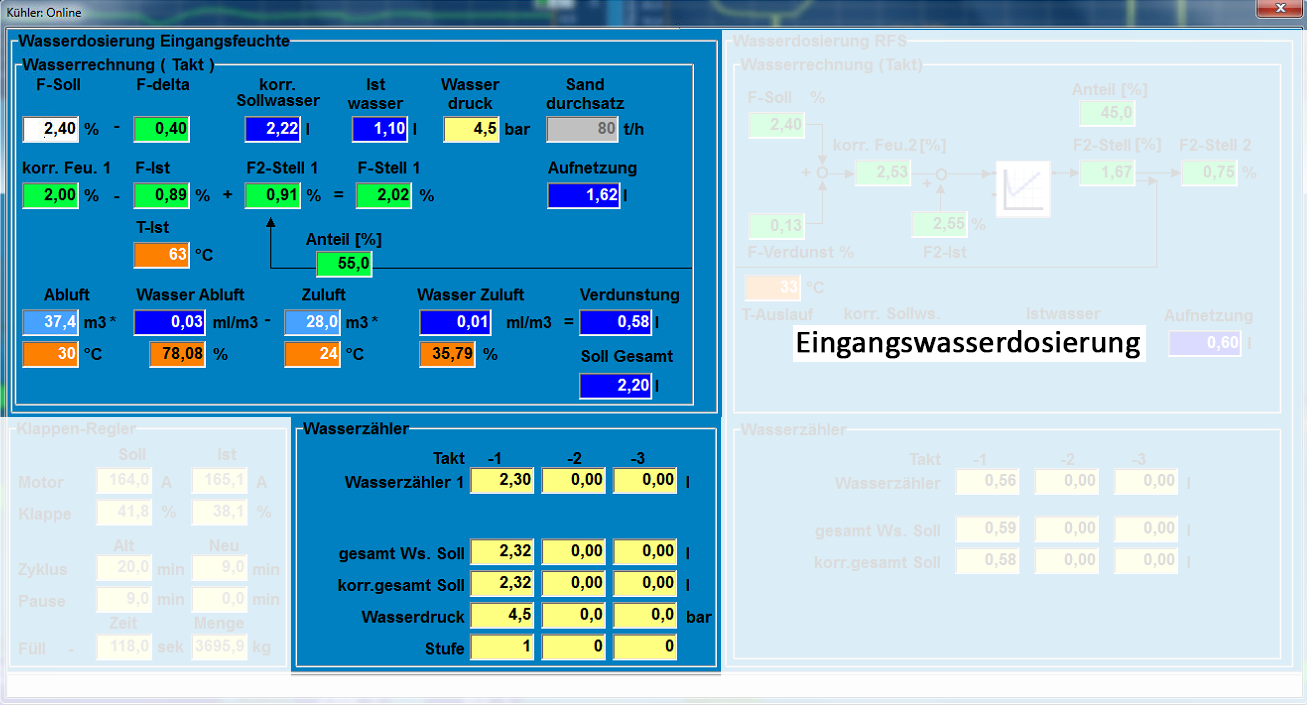
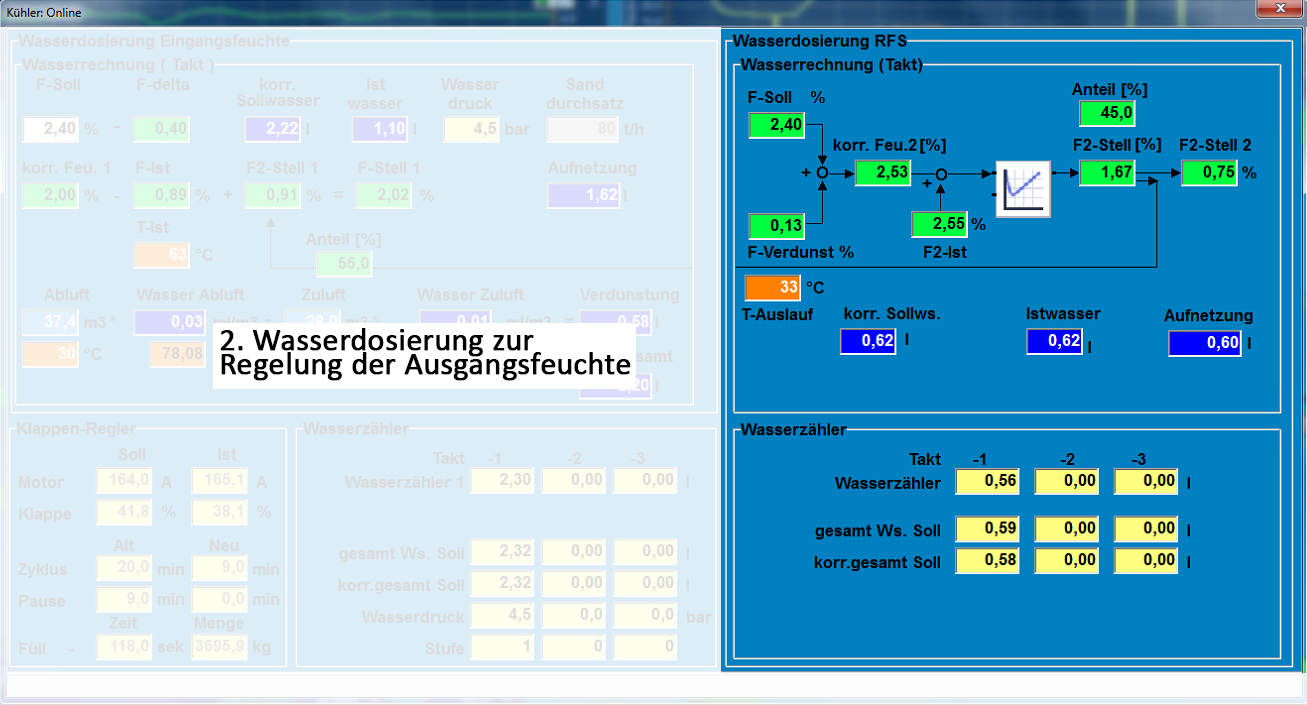
- Parameters for water dosage
- Control of the material transport
- Energy-saving mode
There are also other ways of intervening in the production process.
The visualisation can be located in different places according to the customer's wishes. This enables simultaneous access to the production processes from different points. For example, the operating personnel at the machines can monitor and operate the plant on site. But visualisation in the control room is also possible, as well as in the offices of the responsible persons.
We will be glad to help you with the exact planning. Please feel free to contact us!
The visualisation can be selected in different sizes (from panel to large screen or computer). Here, you as the customer decide which size you need. Please feel free to contact us!
You can find more information about our visualisation here.
